2 Data
2.1 Description
2.1.1 Source
- Our dataset is collected from the Open Government Data (OGD) Platform India.
- Released Under: National Data Sharing and Accessibility Policy (NDSAP)
- Contributor: Ministry of Health and Family Welfare, Department of Health and Family Welfare, International Institute for Population Sciences (IIPS).
- The data is obtained from the fourth round of the Global Youth Tobacco Survey (GYTS-4) conducted in 2019 by the International Institute for Population Sciences (IIPS) under the Ministry of Health and Family Welfare (MoHFW).
2.1.2 About the dataset
The survey was designed to produce national estimates of tobacco use among school-going children aged 13-15 years at the state level and Union Territory (UT) by sex, location of school (rural-urban), and management of school (public-private). The first three rounds of GYTS were conducted in 2003, 2006, and 2009.
A total of 97,302 students from 987 schools (Public-544; Private-443) participated in the survey. Of these, 80,772 students aged 13-15 years were considered for reporting. The objective of the survey was to provide information on tobacco use, cessation, second-hand smoke, access and availability, exposure to anti-tobacco information, awareness and receptivity to tobacco marketing, knowledge, and attitudes.
Each row consists of 58 variables including (but not limited to) the percent of current tobacco, cigarette, and bidi users in each Indian state (rural and urban), the median age of initiation, exposure at home, source of products, access to advertisements, anti-smoking campaigns, and percentage of schools creating awareness and following guidelines to be tobacco-free.
2.2 Research Plan
2.2.1 Missing Values
We plan to begin by comprehensively understanding our data, prioritizing the handling of missing and null values. Subsequent research on missing values, including the creation of relevant plots, will be conducted.
2.2.2 Non - Numeric Values
Upon closer inspection, it was observed that certain data entries were represented as ‘<7,’ signifying values below 7. Recognizing the importance of having numeric values for comprehensive visualization and analysis, a decision was made to address this issue by imputing the value of 7 in place of ‘<7.’ This imputation strategy aimed to provide a standardized numeric representation, ensuring consistency in the dataset.
2.2.3 Feature Reduction
In this step, the irrelevant columns that were not providing any useful information were removed. This was done to enhance model performance by mitigating the curse of dimensionality and improving computational efficiency, leading to more accurate and efficient models. By eliminating irrelevant or redundant features, feature reduction enhances generalization, reduces noise, and addresses issues like multicollinearity.
Total features - 58
Ever users (Features 3, 5, 7, 9, 11, and 13) - The columns containing percent of ever tobacco, cigarette, and bidi users are dropped as we are focusing our research on the current users of these products in each state.
Feature 26 ( ‘Exposure to tobacco smoke at home/public place (%)’) is dropped as we already have ‘Exposure to tobacco smoke at home(%)’ and ‘Exposure to tobacco smoke inside any enclosed public places (%)’, so it is not providing any new information
Feature 36 and 37 ( ‘Current cigarette smokers who bought cigarettes from a store, paan shop, street vendor, or vending machine(%)’) and ( ‘Current bidi smokers who bought bidi from a store, paan shop, or street vendor (%)’) are dropped as well as it provides repetitive information.
Feature 41 and 42 ( ‘Bought Cigarette as individual sticks in past 30 days(%)’) and ( ‘Bought Bidi as individual sticks in past 30 days (%)’) are dropped as they do not provide any meaningful insights.
New number of features - 47
2.2.4 Proposal
- Compare tobacco use rates (current users) across different states and regions of India to identify patterns and trends geographically. This could examine differences between urban and rural areas as well.
- Study the effectiveness of anti-tobacco messages and tobacco control policies by correlating measures like exposure to messages, support for policies, quit attempts, etc. with tobacco use rates. This could identify best practices.
- Evaluate the impact of banning smoking in public places by comparing rates of exposure to secondhand smoke in public areas before and after implementation over time across states with different policies.
- Examine access to tobacco products among youth by analyzing refusal rates for cigarette/bidi sales due to age, sources of obtaining tobacco (store, paan shop), and exposure to point-of-sale advertising.
- Study knowledge, attitudes and perceptions related to tobacco use through measures like harm perception, quitting difficulty, anti-tobacco messaging to characterize differences across states and inform communication campaigns.
- Assess compliance with tobacco control policies (COTPA guidelines, school policies) through school administrator surveys and correlate strength of policy implementation with student tobacco use rates.
2.3 Missing value analysis
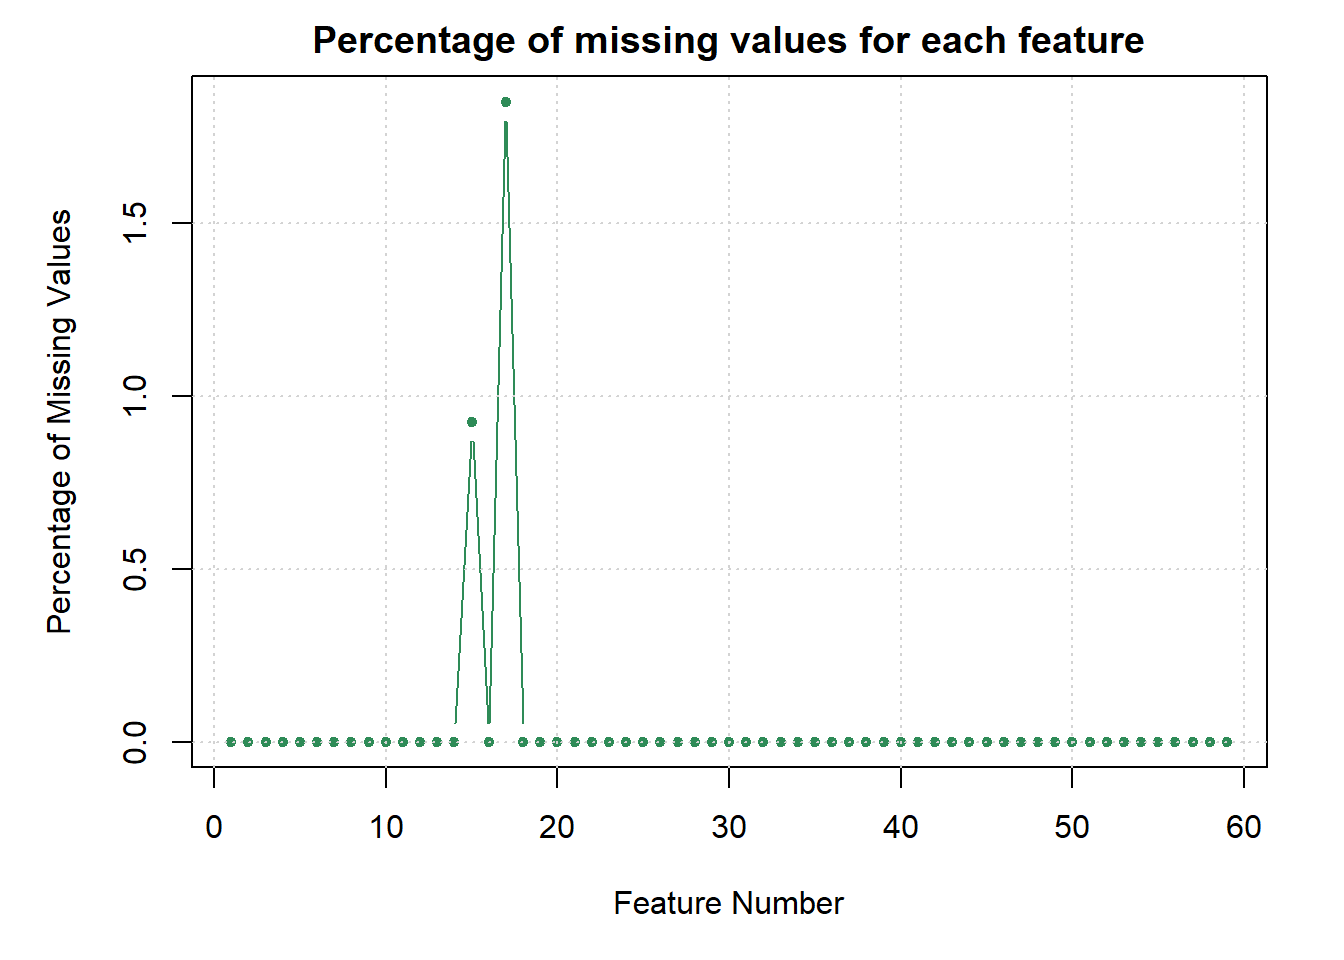
The line graph illustrates that feature number 15 has approximately 0.9% missing values, whereas feature 17 exhibits nearly double the percentage, with around 1.8% of missing values. Notably, the remaining features in this dataset show no instances of missing values, suggesting that the dataset is generally free from substantial issues related to incomplete data.
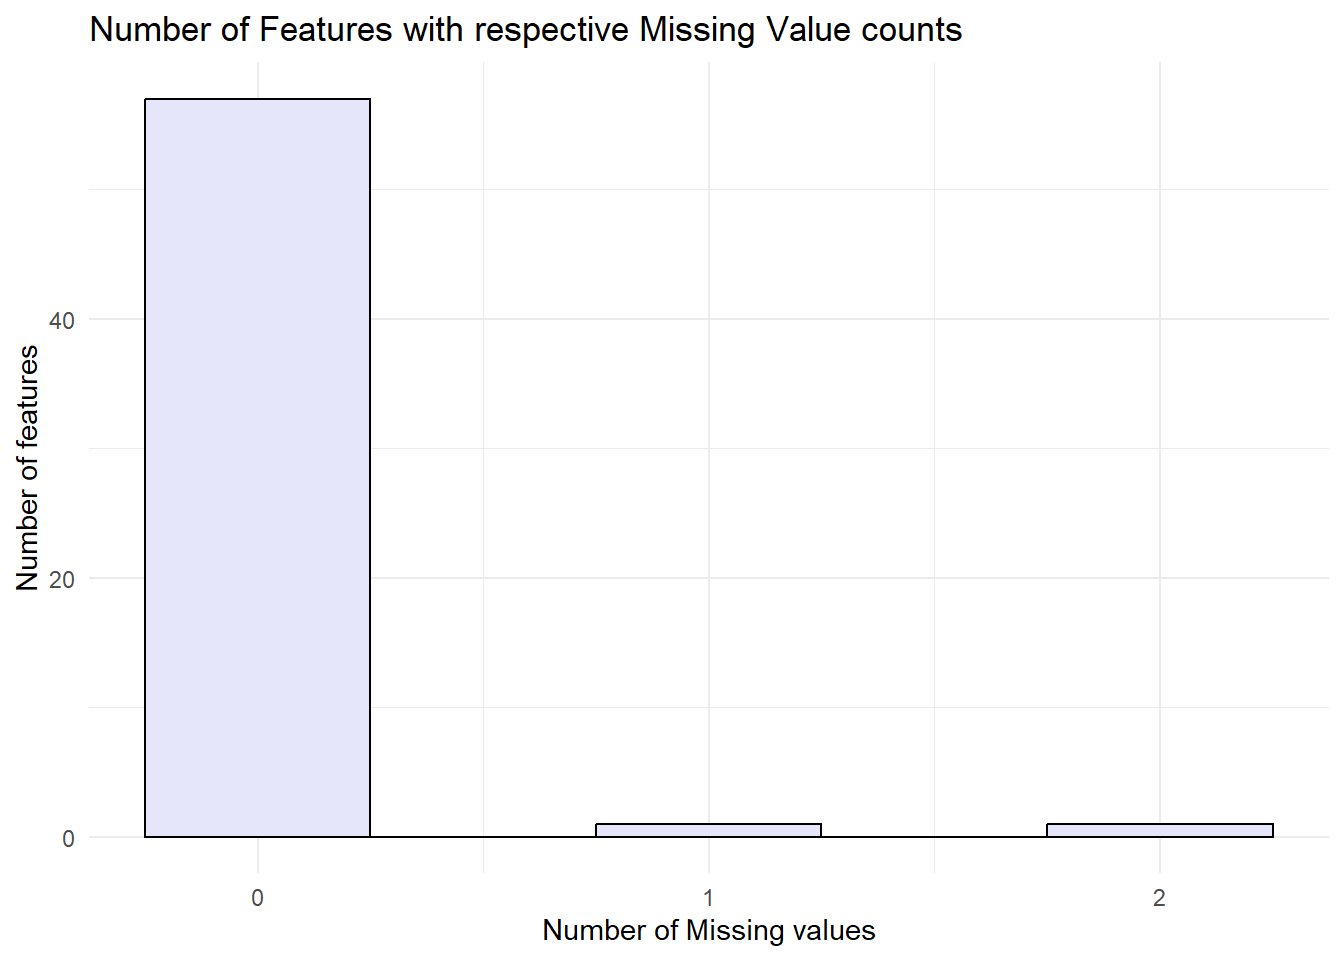
The bar graph illustrates that more than 50 features have no missing values, while only one feature has one missing value, and another feature has two missing values.